Into the Weather – Part 3 – Publishing Data to the Cloud – 1
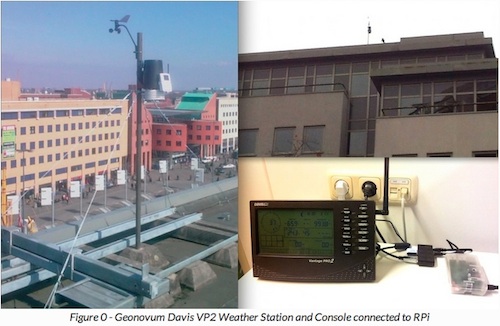
In my last post, Into the Weather – Part 2 , I outlined a global architecture of a Davis Vantage Pro2 weather station connected to a Raspberry Pi (RPi) running weewx weather software to capture raw weather data. Here I will try to depict how to bring this weather data “from the fluffy clouds into the digital cloud”. Finally, at the end, also some geospatial content. The image below shows the weather station sensors at the Geonovum building rooftop (was quite hazardous replacing a faulty temperature sensor there!) and the Davis console connected to the Raspberry Pi (transparent enclosure). All documentation and code can be found via: sospilot.readthedocs.org .
To recap: the Davis Weather Station continuously captures raw weather data through its sensors: temperature (out/in), pressure, wind (speed, direction), rainfall and even UV-radiation. This data is initially gathered within the local console display. This is fine for personal/local usage, but for capturing history, deriving trends and in particular for external sharing this is quite limited. The real fun starts with getting access to the raw data and go from there.
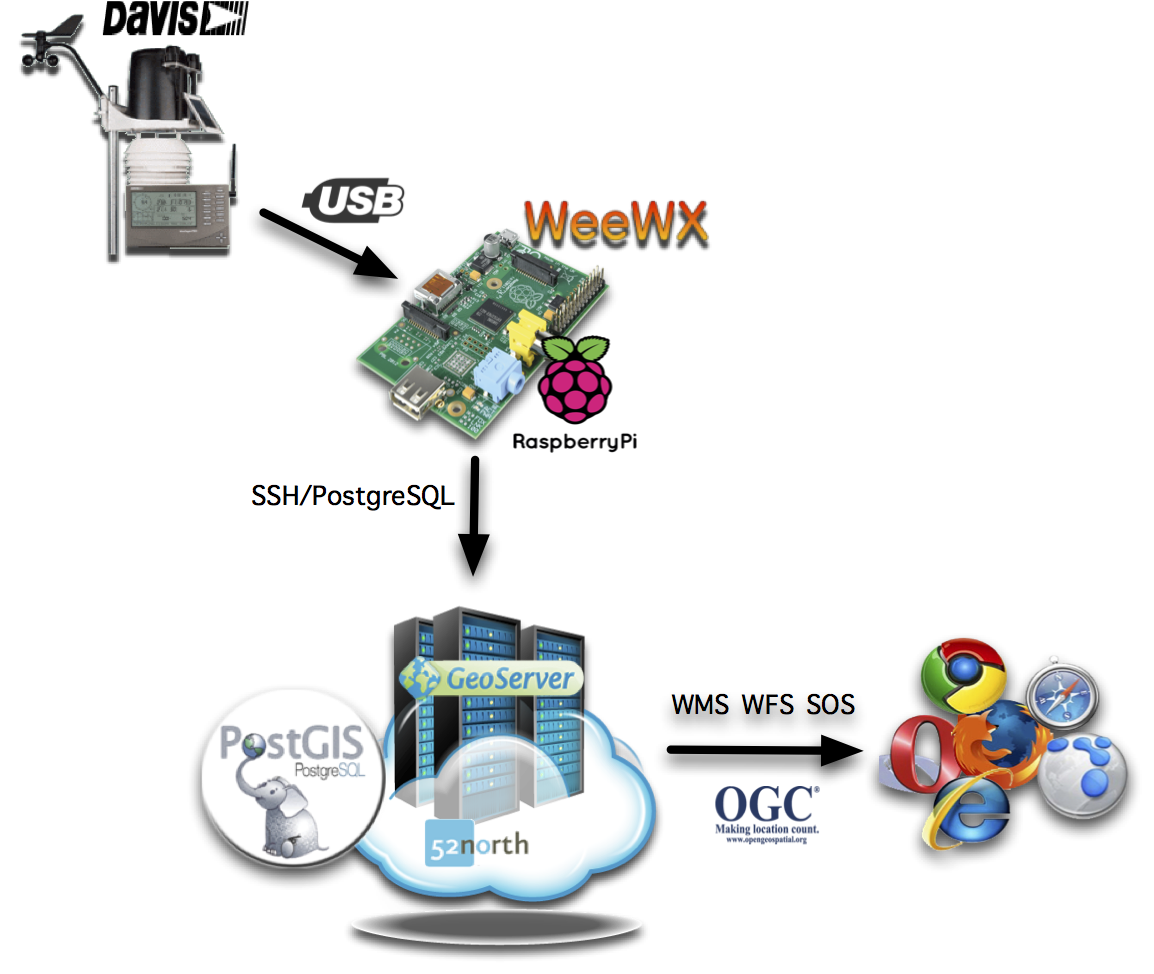
This is where the Raspberry Pi with weewx and later Stetl , PostGIS, GeoServer and the 52North SOS come in, but I’ll go step-by-step. Let’s first see how we can publish weather data with just weewx.
My first post Into the Weather – Part 1 in this series introduced weewx, a Python framework for capturing, storing and publishing weather data. The Davis weather station is connected via USB to the RPi. The RPi runs weewx to gather and store weather data (in a SQLite DB) from the weather station. But weewx can do more than this: it can also publish weather data to a variety of services. As any well-designed framework, weewx is basically a kernel, the weewx engine with configurable plugins, all specified and parameterized from a single configuration file weewx.conf, like in this example . The weewx daemon process runs forever in a main loop continuously calling on all plugins.
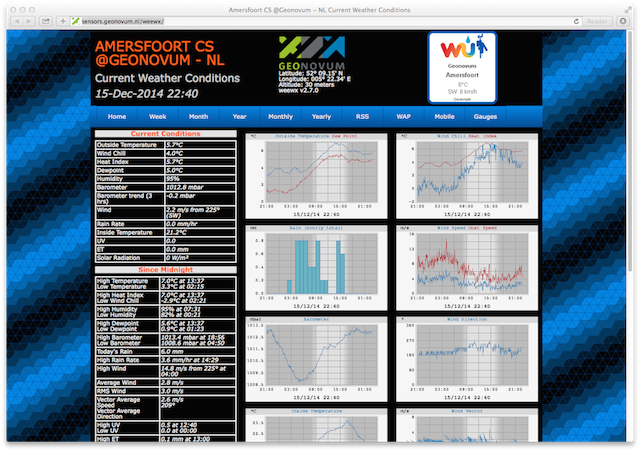
First there are weewx station-drivers that continuously capture raw data from most common weather stations. Although there are many brands of weather stations, many will share common hardware and protocols. The second class of plugins are archiving drivers, where/how to store raw weather data. Two standard archiving drivers are available: SQLite and MySQL. My choice: SQLite. For publication from archived data, a standard reporting driver generates a plain HTML website using an extensible skin containing (HTML) templates. By configuring an FTP or rsync destination, the generated HTML can be published to a remote webserver. This is the first connection to the digital cloud. Off course the skin and templates are highly configurable as in this example . Many examples can be found on the web. I found the nice byteweather-template by Chris Davies-Barnard . Below is the result as can be found at: sensors.geonovum.nl/weewx .
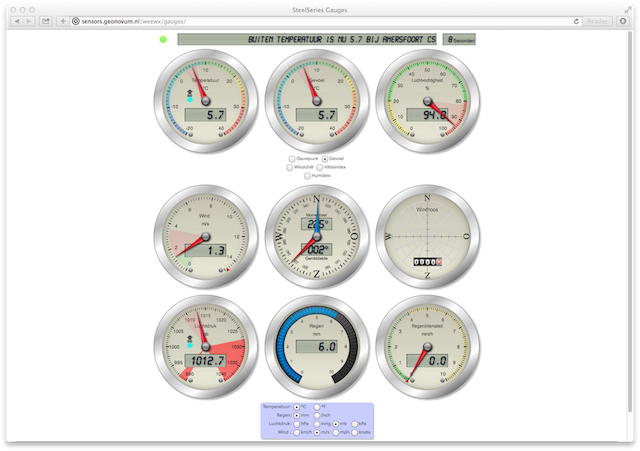
In addition, I’ve added even a more dynamic weather display like the Steelseries Gauges , as seen below and via the link sensors.geonovum.nl/weewx/gauges .
Just like other crowd-sourced projects like OpenStreetMap and WikiPedia there are various weather communities where you can join and publish your weather data via RESTful APIs. weewx provides drivers for most common communities like Weather Underground and PWSWeather . For example, I registered the Geonovum weather station as Geonovum IUTRECHT96 as below.
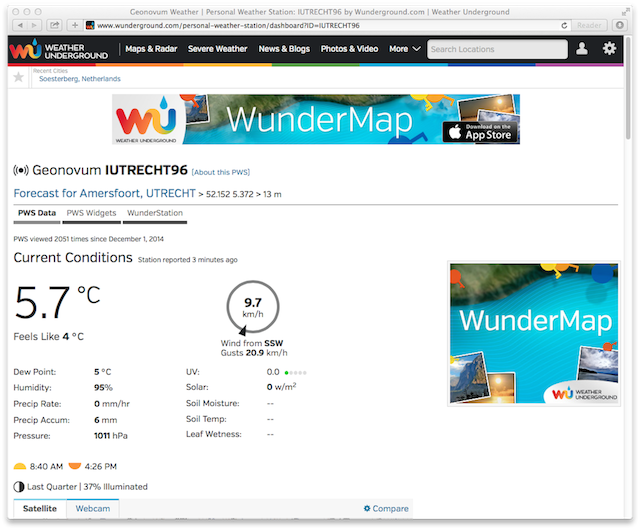
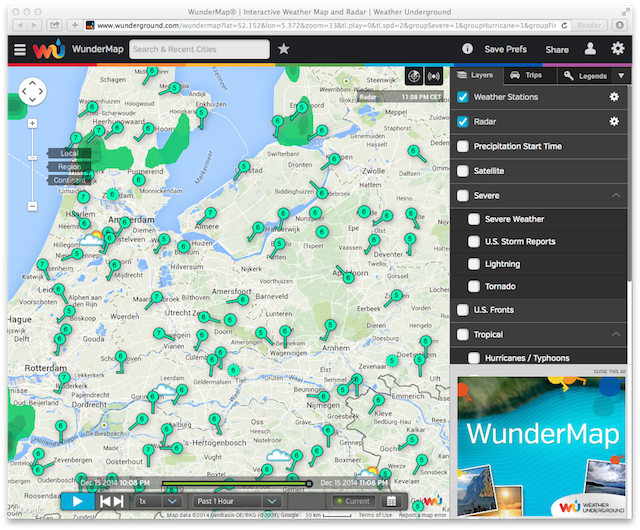
Weather Underground also provides various apps and a map, the WunderMap . Here you can view your station, together with all others that jointly provide weather data. As can be seen there is already quite some coverage within The Netherlands.
All in all, there is a fascinating world to explore once you get into the weather domain and its many communities.
So why am I doing all of this? Apart from having the opportunity to develop this as part of the SOSPilot Project at Geonovum , I think that “geospatial” is moving from 2D to “N-dimensional”: not only more and more “3D” is hitting the shores (just see the recent 2014 blogs at planet.osgeo.org ), but also location-based sensor data (like Air Quality and weather data) and the Internet of Things drives a need to deal with time-series data: management, storage, services and visualization. Within the Open Source geospatial world I happily see that many frameworks and tools are extended to deal with 3D, like OpenLayers/Cesium (one of my next posts) and PostGIS/PDAL and with Time like in GeoServer Dimension support. Also the OGC Sensor Web Enablement and its lighter-weight version OGC SensorThings is gaining more attention.
Not yet done with the weather. Next post I will dive into further unlocking weather data via OGC services like WMS and SOS. That would be “Publishing Data to Cloud 9” ;-)