Into the Weather – Part 1 – Exploring weewx
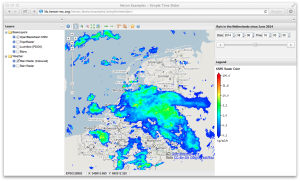
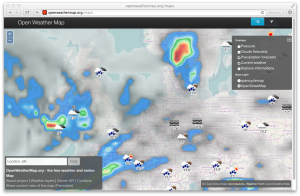
Tagging this post as “Part 1” is ambitious. Beware: there is hardly any “geo” for now. In the coming time I hope to share some technical experiences with weather stations, weather software and ultimately exposing weather data via some open geospatial standards like OGC WMS(-Time) as in example image right , WFS and in particular SOS (Sensor Observation Service) . The context is an exciting project with Geonovum in the Netherlands: to transform and expose (via web services and reporting) open/raw Air Quality data from RIVM , the Dutch National Institute for Public Health and the Environment. The main link to this project is sensors.geonovum.nl . All software is developed as FOSS via a GitHub project . There are already some results there. I may post on these later.
Within a sub-project the aim is to expose measurements from a physical weather station via standardized OGC web services like WMS, WFS and SOS. As a first step I dived into the world of weather hardware and software, in particular their vivid open source/open data communities. A whole new world expanded to me. To no surprise: Location and The Weather are part of everyday life since the beginnings of humanity. OpenWeatherMap and Weather Underground are just two of the many communities around open weather data. In addition there’s an abundance of FOSS weather software. Personal weather stations are measuring not just temperature but also pressure, humidity, rainfall, wind, up to UV radiation and are built homebrew or bought for as cheap as $50,-.
Being a noob in weather soft/hardware technology I had to start somewhere and then go step-by-step. The overall “architecture” can be even depicted in text:
1weather station --> soft/middleware --> web services + reporting
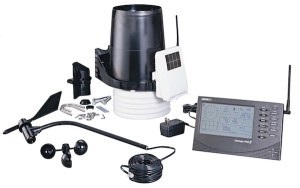
Being more of a software person, I decided to start with the weather soft/middleware. Also, since Geonovum already owns a Davis Vantage Pro2 Weather Station and the Raspberry Pi B+ I plan to use is still underway…
From what I gathered, weewx is the most widely used engine/framework within the weather FOSS community. Also the fact that it is written in Python with a very extensible architecture immediately settled my choice. Explaining weewx is a subject by itself but very well documented . I’ll try in a few sentences what weewx does:
- collect current and archive weather station measurement data (drivers)
- storing weather data (archive and statistics) in a database (SQLite or MySQL)
- submitting data to weather community services like Weather Underground
- creating formatted/templated reports for your local or remote website
Any of these functionalities is highly extensible through a configurable plugin architecture. The drivers support most common weather stations. Installing is a breeze, either in a local directory or via Linux package managers. Also note that weather data have quite some different local units (Fahrenheit/Celsius, knots/meters etc). weewx will all take care of this.
So, not yet having access to a weather station, what could I do? One of the weather station drivers is the Simulator which intelligently generates weather data for testing.
Trying to have some real-world data I set out on what appeared to be a two-hour hack: create a weather station driver that obtains its data from an open weather API. There are many off course. I choose the OpenWeatherMap API to get data in the area of our cabin in the woods near the place of Otterlo in the Netherlands . Writing this hard-coded driver took just a few line of Python. The source code can be found here . To not overask the API, I’ve set the time interval to 2 minutes within the weewx configuration file . Also it would not be fair to report these values to any of the weather communities. If the weewx community is interested I can donate this software, with some generalization (e.g. URLvia config).
But all in all my first driver is still running fine in weewx. The main challenge was converting all the values between different metric systems. weewx allows and even encourages you to store all data in US metrics. All the reporting and conversion utilities will always allow you to show your local metric units.
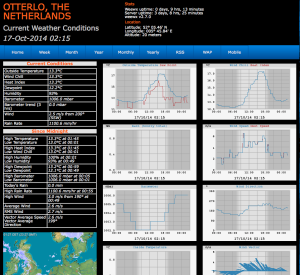
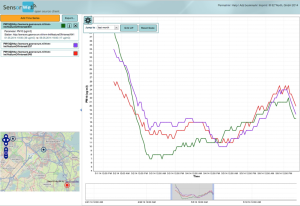
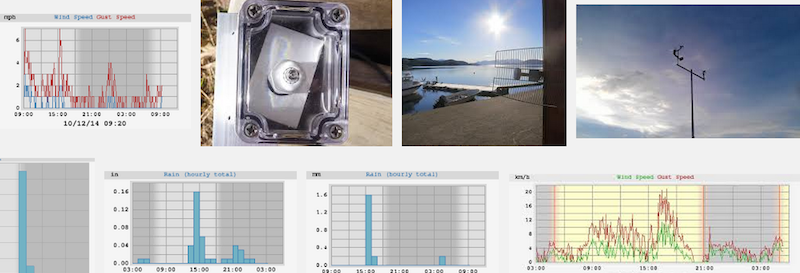
As a Linux daemon now runs fine in our test system. It is time to show some results. weewx reporting is basically a website generated via Cheetah templates . The default template is basic white on black. I found a nice template called Byteweather . You can find my continuous weather report here at sensors.geonovum.nl/weather . Measurements are now building up thanks to the weewx archive database. Values are mostly matching Dutch weather station data. Expect for the rainfall…Surely we have lots of rain but not that much…
Next posting I hope to tell more about deploying the Raspberry Pi and connecting to the Geonovum Davis Weather station. Then there will be also more “geo” in the post, I promise!