Emit #5 – Assembling and Deploying 5 AirSensEURs – a Story in Pictures
This is Emit #5, in a series of blog-posts around the Smart Emission Platform , an Open Source software component framework that facilitates the acquisition, processing and (OGC web-API) unlocking of spatiotemporal sensor-data, mainly for Air Quality and other environmental sensor-data like noise.
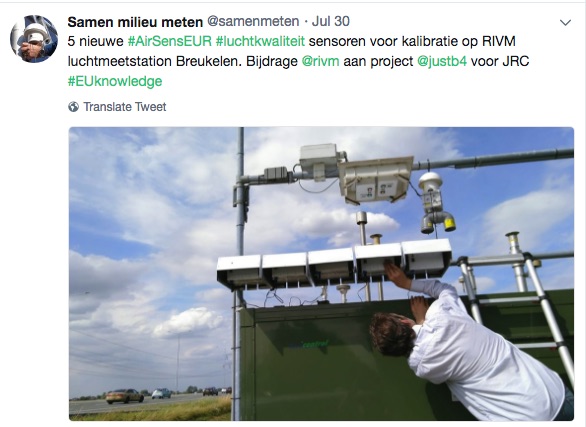
Summer holidays and a heat-wave strikes The Netherlands. Time for some lighter material mainly told in pictures. As highlighted in Emit #2 , I have the honor of doing a project for the European Union Joint Research Centre (EU JRC), to deploy five AirSensEUR (ASE) boxes within The Netherlands, attaching these to the Smart Emission Platform in cooperation with RIVM (National Institute for Public Health and the Environment). The ASE boxes measure four Air Quality (AQ) indicators: NO2 (Nitrogen Dioxide), NO (Nitrogen Monoxide), O3 (Ozone) and CO (Carbon Monoxide) plus meteo (Temp, Humidity, Air Pressure) and GPS. Read more on ASE in this article .
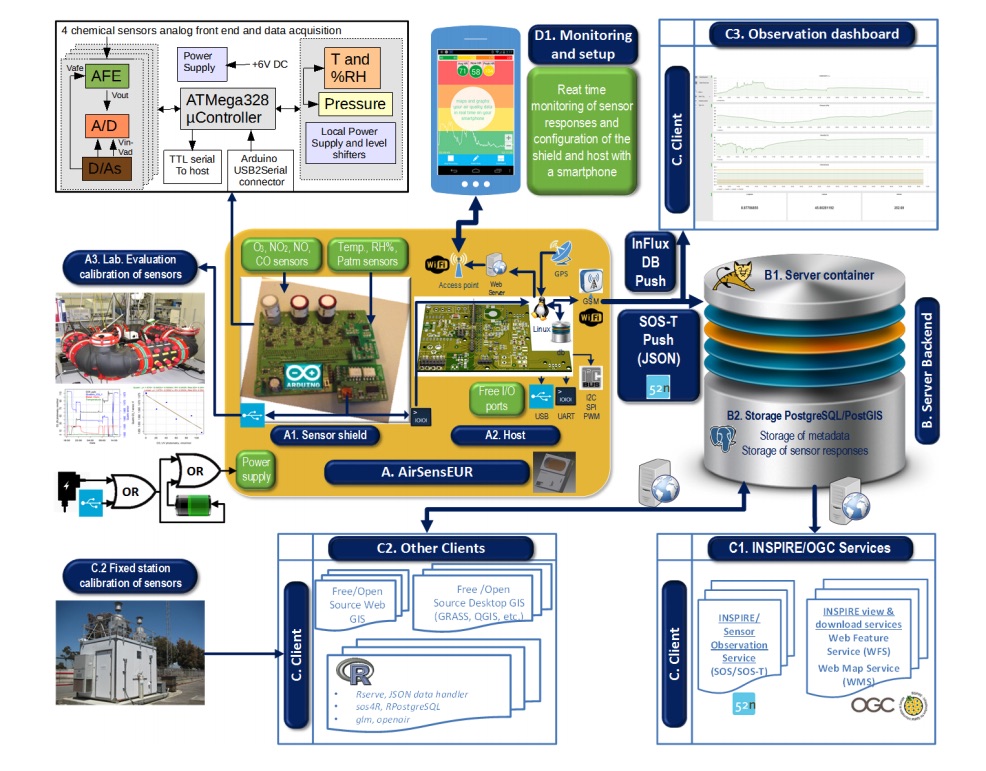
The ASE is an Open Hard/Software platform that can be configured with multiple brands/types of sensors. In the current case all four above mentioned AQ sensors are from AlphaSense . As these are relatively cheap sensors (< $100,-), the challenge is to have these calibrated before final deployment. This calibration is done by placing the ASE boxes first at an RIVM station, gather data for a month or two and then calibrate these sensors from official RIVM reference measurements at the same location. Using both the raw ASE data and the RIVM reference data the calibration “formulae” can be determined, before placing the ASEs at their final deployment locations around The Netherlands and have the Smart Emission Platform assemble/publish the (calibrated) data for the next year or so. More info on AirSensEUR via this Google Search .
Ok, picture time! Explanatory text is below each picture.
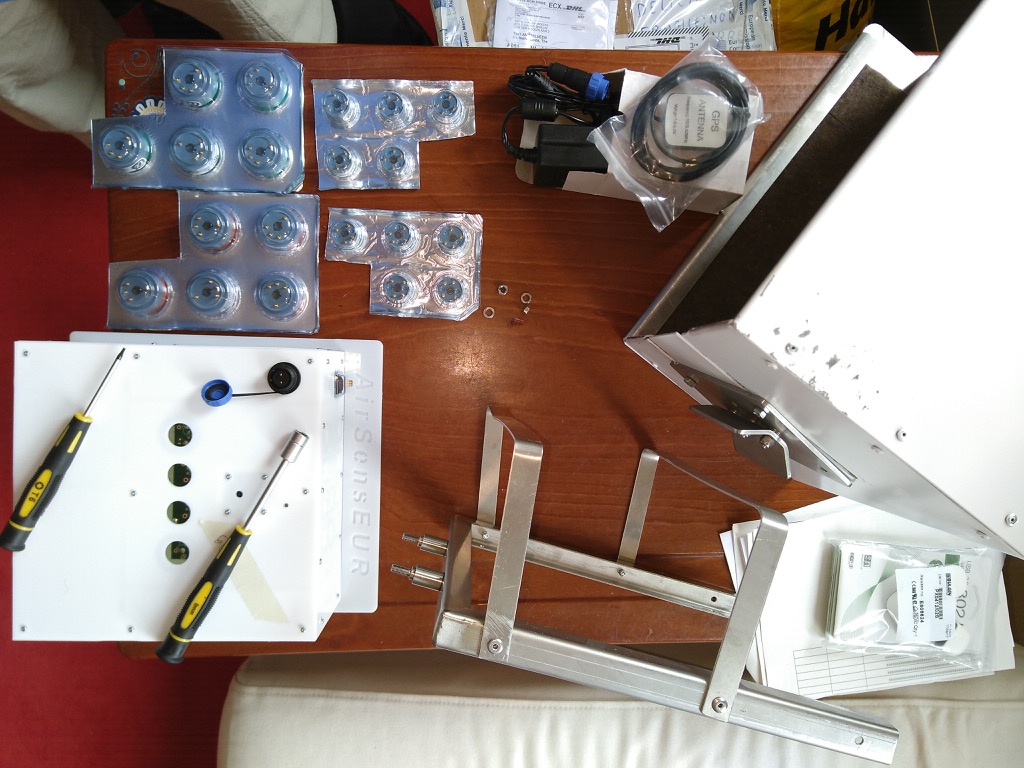
Picture 1: Boxes arrived from EU JRC Italy on June 12, 2018. Assembling: upper left shows the (total of 20) AlphaSense sensors like “blisters” (Dutch “doordrukstrips”), the ASE box (with screwdrivers on top) and the protecting metal outer shield on the right.
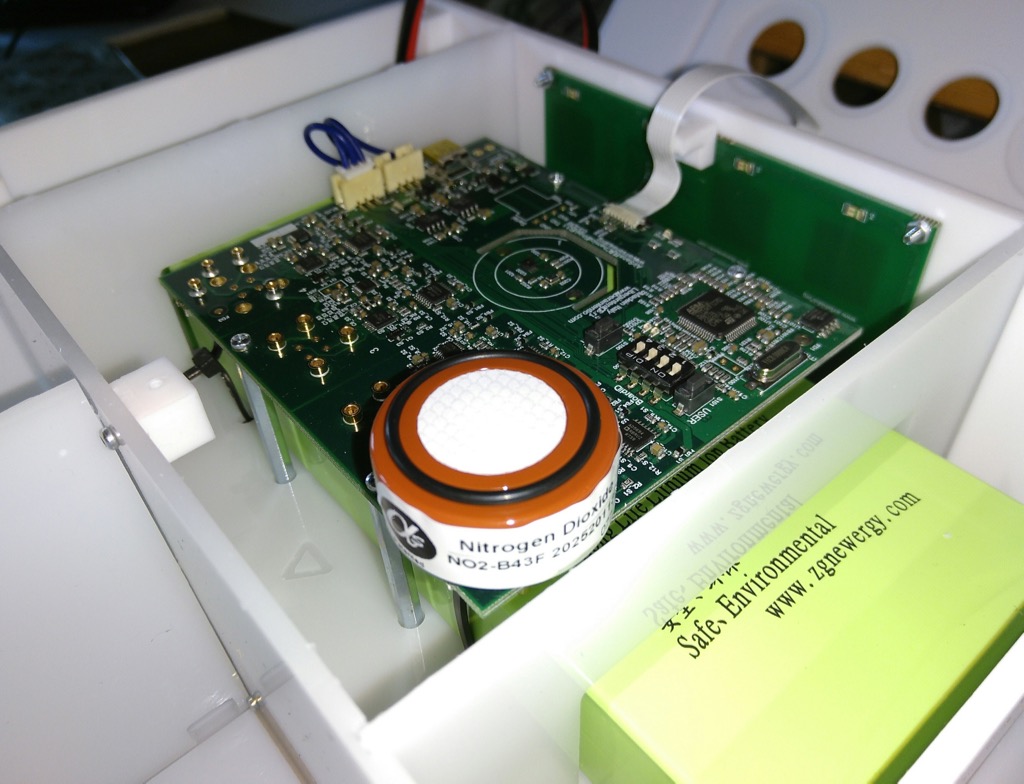
Picture 2: Very carefully placing the AlphaSense sensors in the ASE Sensor Shield (an Arduino-like board) without touching the top-membrane!
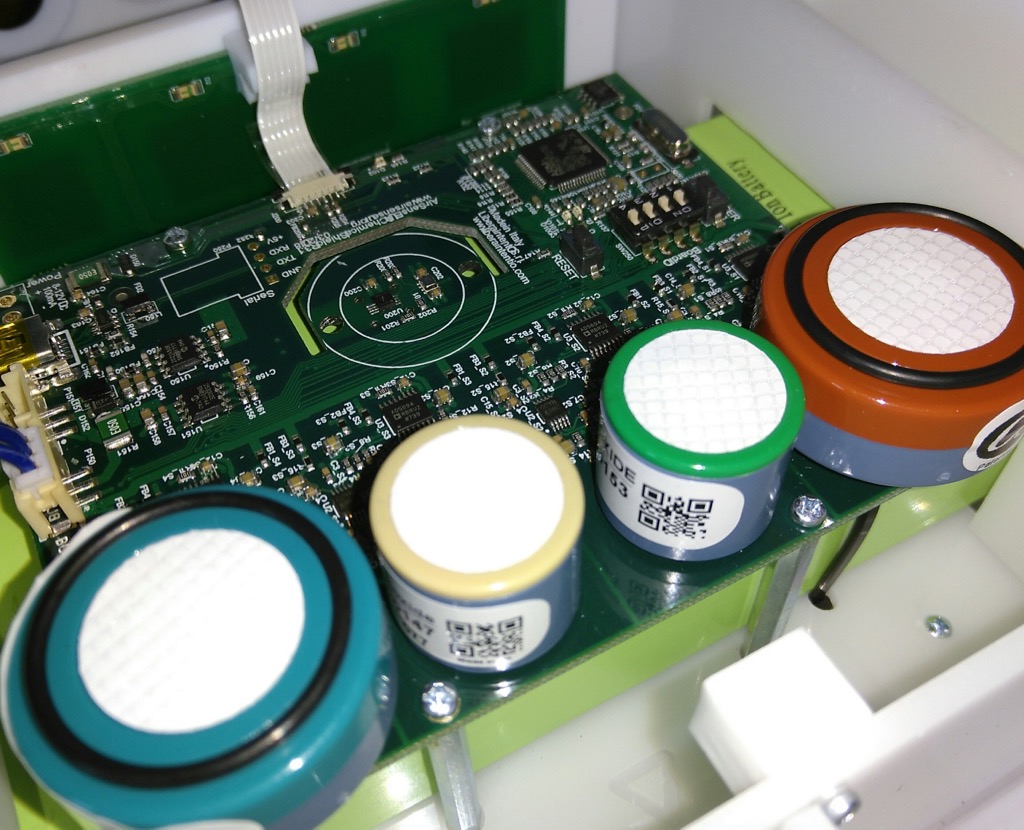
Picture 3: all sensors placed, attach current and next to network and other configuring!
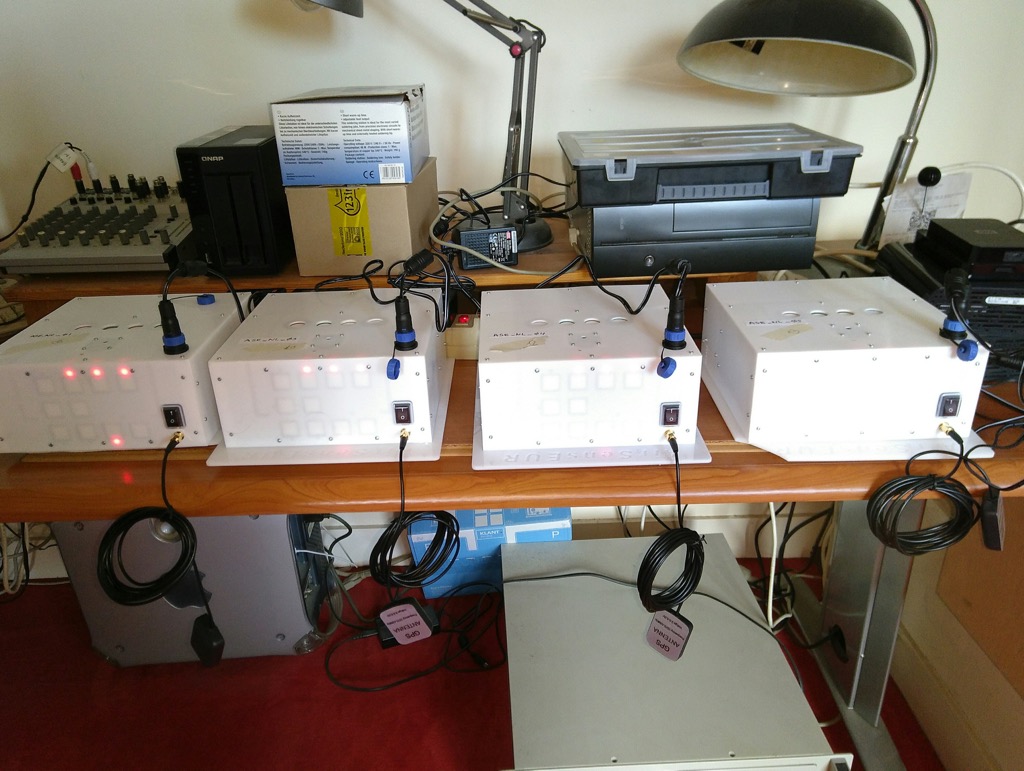
Picture 4: On default startup (via touch buttons) the ASE will expose a default WIFI access point. This can be used to attach and to login at the “ASE Host Board”, a Raspberry Pi-like board running standard Linux Debian. SSH into each box and further configure e.g. the WIFI settings to become a WIFI client, first having all boxes connect to the local office WLAN.
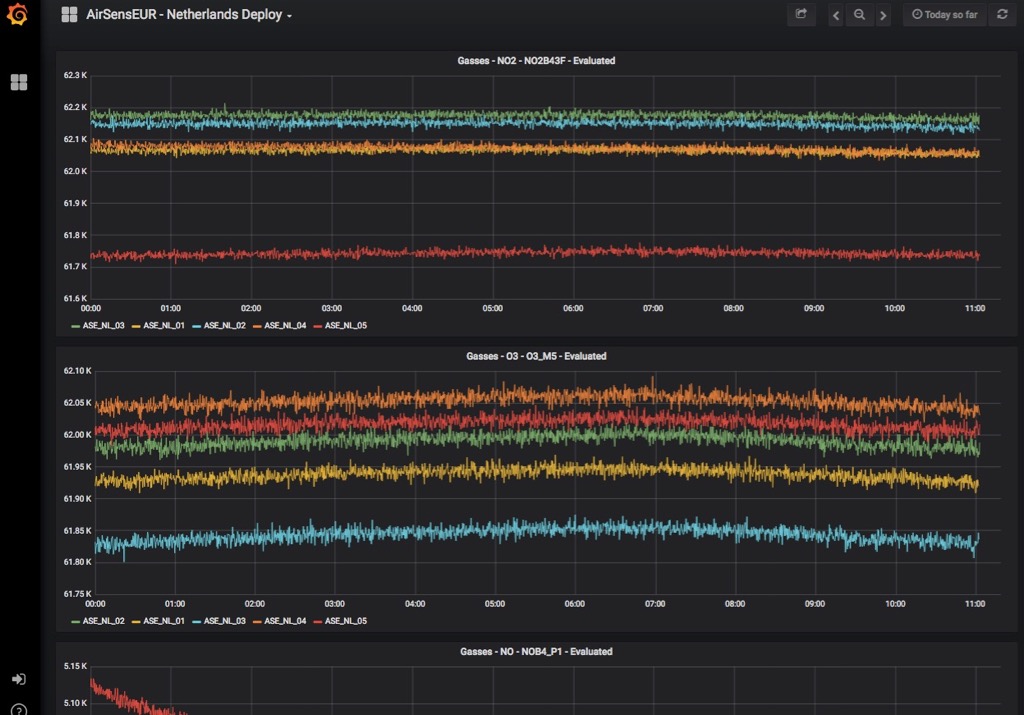
Picture 5. Each box runs a Data Aggregator and can be configured to push data to a remote InfluxDB database. In our case we have setup a Smart Emission InfluxDB Data Collector where the (raw) data is received. This InfluxDB datastore is visualized using a Grafana Panel shown in the picture. We see the five boxes ASE_NL_01-05 sensing and pushing data!
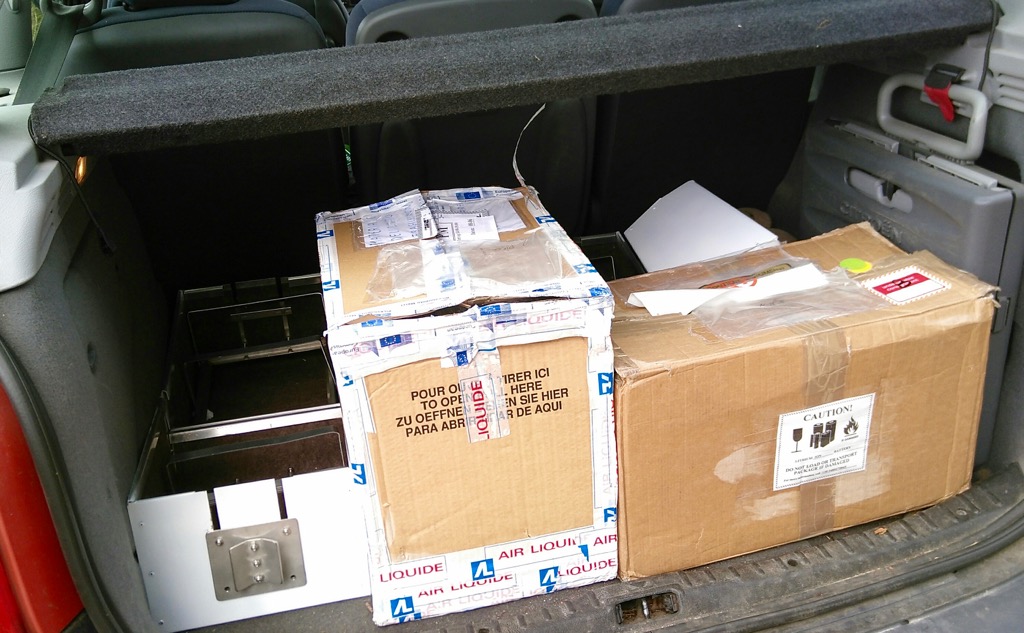
Picture 6. A good start, but next we need to go out and place the boxes at the RIVM station for a period of calibration. So tearing down, packing, all into the trunk of my car. Up to the RIVM station! July 30, 2018, Still 35 degrees C outside.
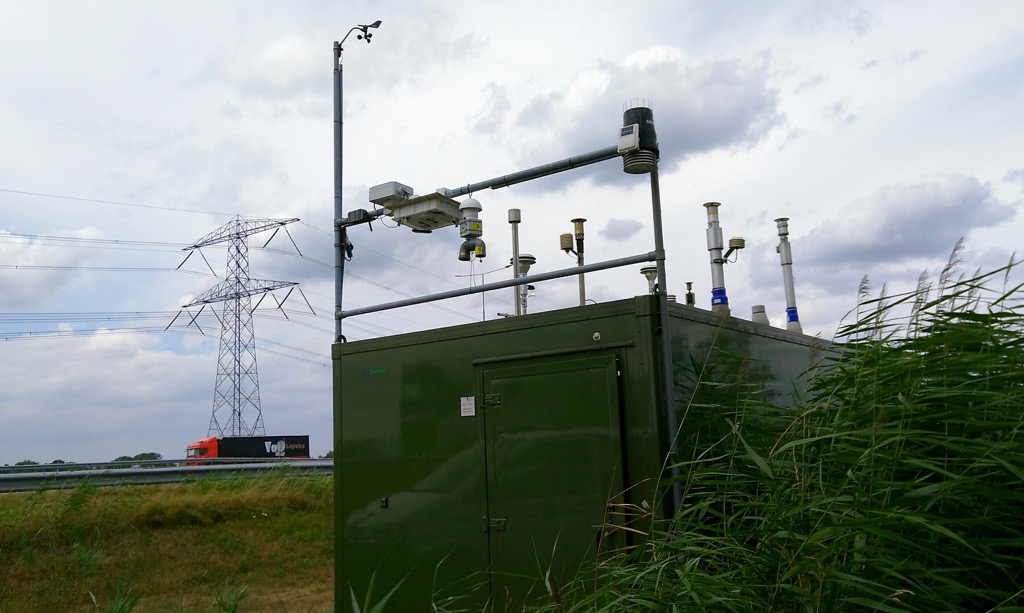
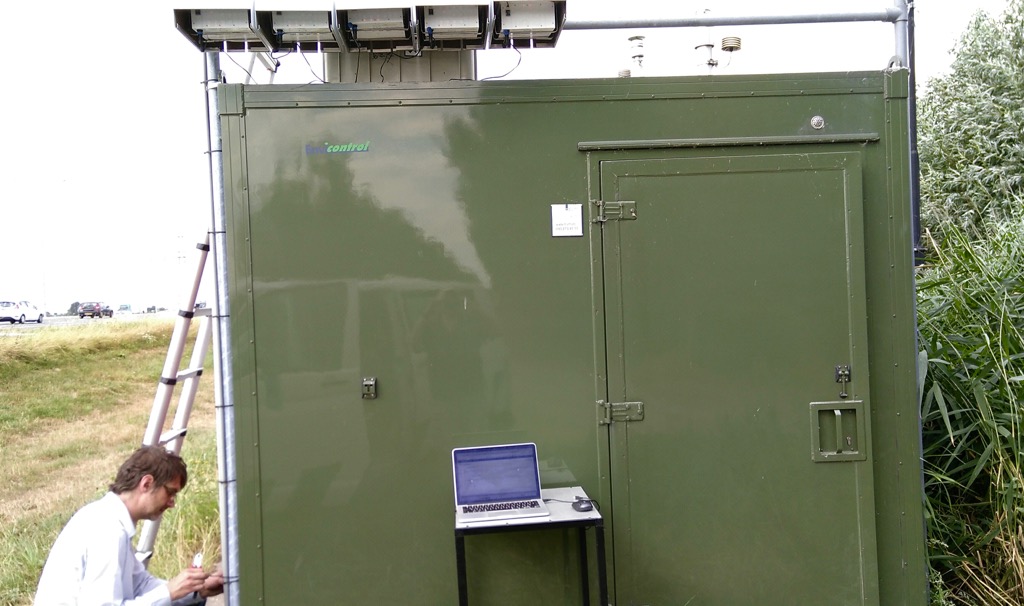
Picture 7. July 30, 2018, 13:00. Arrived at the RIVM station. Now to figure out how to attach the five boxes. The lower horizontal iron pole seems the best option. Put all soft/hardware knowledge away, now real plumbing is required!
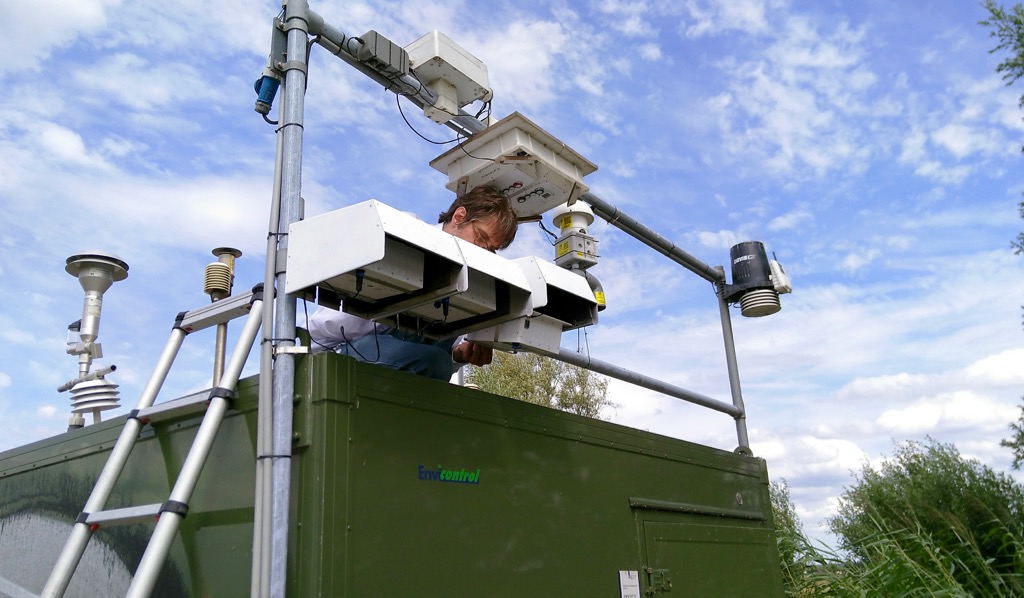
Picture 8. Jan Vonk of RIVM, who also have deployed about 12 ASEs, placing the first boxes on the horizontal pole, so far so good.
Picture 9. All five boxes strapped to the pole. Jan Vonk doing the hard work. Next challenge: they need power and WIFI…
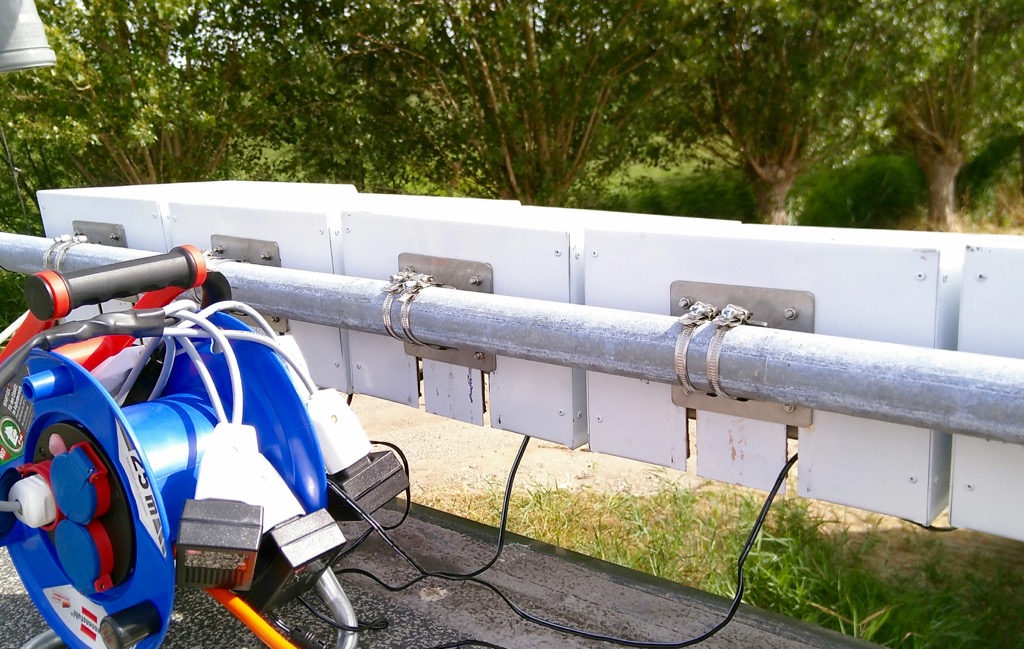
Picture 10. One cannot have enough power sockets.
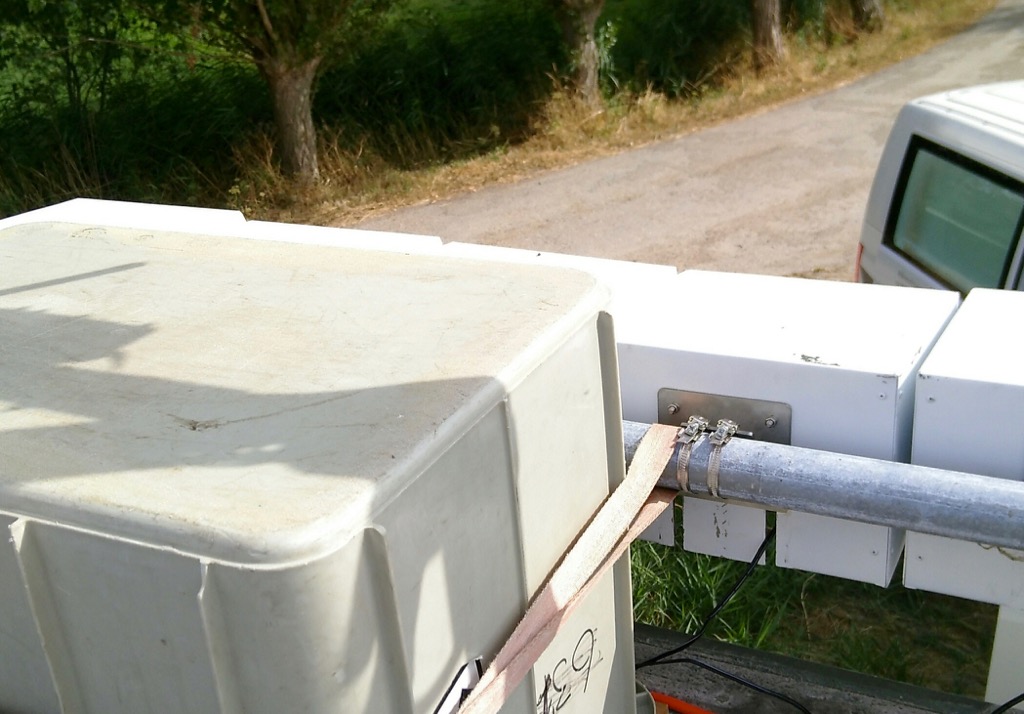
Picture 11. Covering all power supply stuff under tightened box shielded from rain.
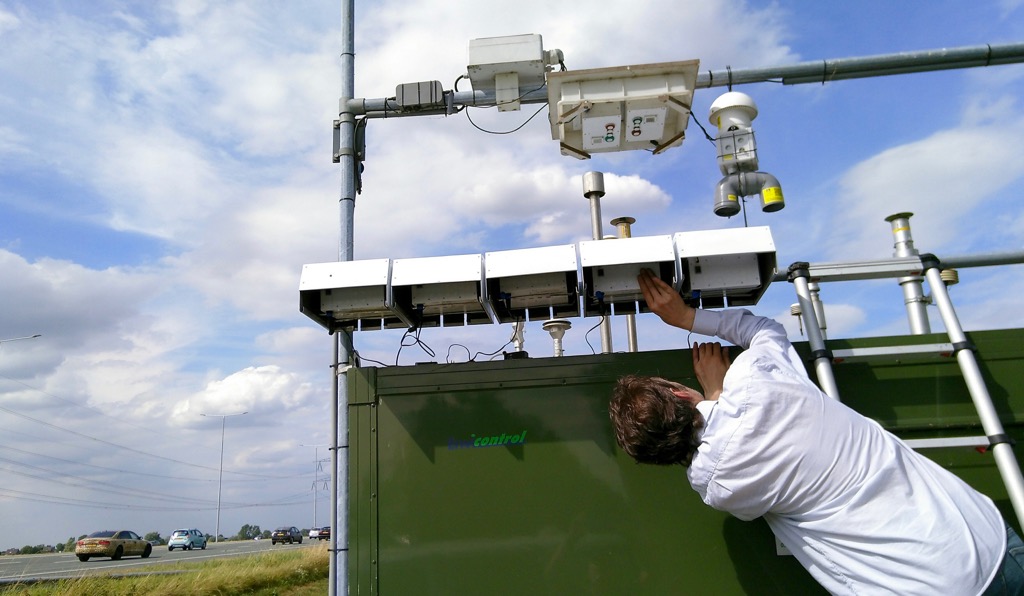
Picture 12. July 30, 2018, 17:00. Last challenge: booting up the boxes and have them connecting to the local RIVM station’s WIFI. I had pre-configured WLAN settings in each box, but this is always a moment of truth: will they connect? If they do they will start sampling and push their raw data to the Smart Emission Platform…Then we can start the calibration period. And success ... they connected!
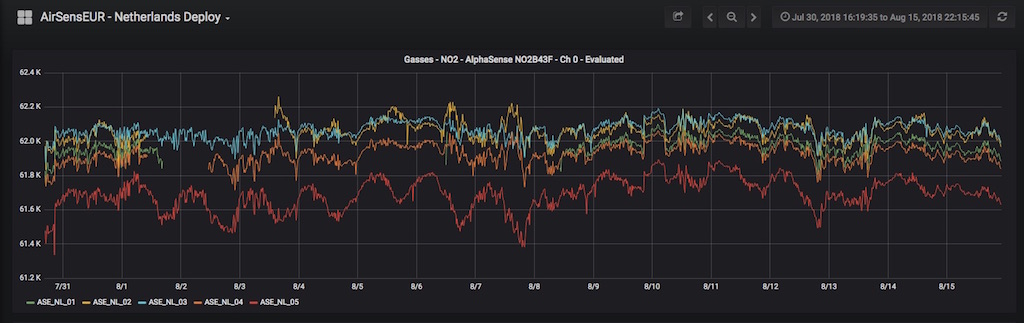
Picture 13. Now on August 15, 2018, with minor hickups, and with great help from the JRC folks Marco Signorini and Michel Gerboles, we have all five boxes sampling and pushing data for the calibration period. The above plot shows raw NO2 data, to be calibrated.
So a good start! The heatwave is over, the next hard work is calibration. Why are we doing this? Well, like with meteorology, RIVM and others are stimulating Air Quality to be measured by basically anyone, from groups of civilians to individuals. For this RIVM has setup the program “Samen meten aan Luchtkwaliteit” (“Together measuring air quality”). Measuring Air Quality is not an easy task. We need to learn by doing, make mistakes, and spread knowledge gained. Both AirSensEUR and Smart Emission are therefore Open. Below some further links:
Smart Emission: GitHub , WebSite , Documentation , and Docker Images .