Emit #4 – Push or Pull?
This is Emit #4, in a series of blog-posts around the Smart Emission Platform , an Open Source software component framework that facilitates the acquisition, processing and (OGC web-API) unlocking of spatiotemporal sensor-data, mainly for Air Quality and other environmental sensor-data like noise.
A lot of things have happened with the project since the last Emit #3 (feb 2018 already). The main news is that the SE Platform is now being migrated to the national Dutch GDI services infrastructure, PDOK . This infrastructure, entirely built with OSGeo software, is maintained by the Dutch Kadaster and already (since 2010) provides open access to Dutch geospatial datasets and -services including the Dutch INSPIRE access point. Having the SE Platform hosted and maintained within PDOK gives a tremendous opportunity for long-term evolution and stability beyond its initial project-based funding.
There’s lots of exciting new technological details related to this migration, like the move from the current ad-hoc Docker-based deployment to a full-fledged Kubernetes (K8s) Cloud roll-out. This could be the subject of an entire post by itself. For this we’re setting up a fresh GitHub organization , plus SE Docker Images via DockerHub . All work-in-progress but first results are already tangible.
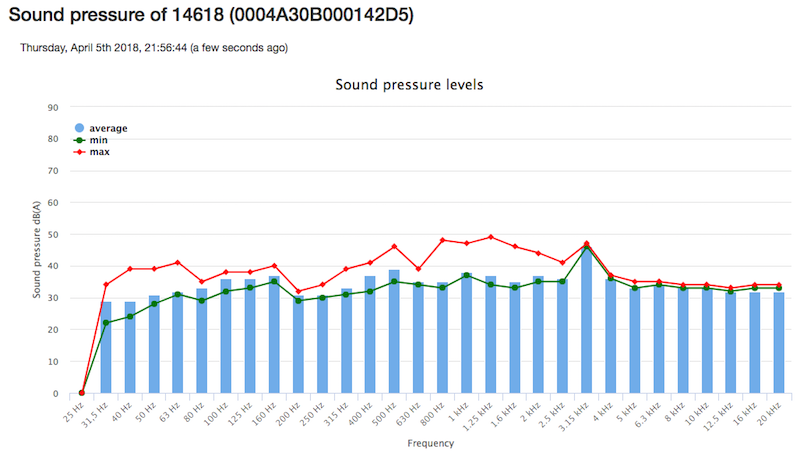
So what’s this Push or Pull about? As announced in Emit #1 , I’ll try to explain the SE architecture “by following the data”. So sensor data is acquired by sensor stations constantly, 24 hours a day, and lots of it. To give somewhat of a figure: within the SE project the Intemo Sensor Station “Josene” station provides more than 100 different sensor values, “indicators”. These range from meteo-data like Temperature, Humidity, Pressure, to Air Quality values for NO2 (Nitrogen Dioxide), CO2 (Carbon Dioxide), O3 (Ozone), finedust (PM) and audio/noise indicators (sound pressure) like Decibels (A) min/max/average for about 30 frequency bands (see image below).
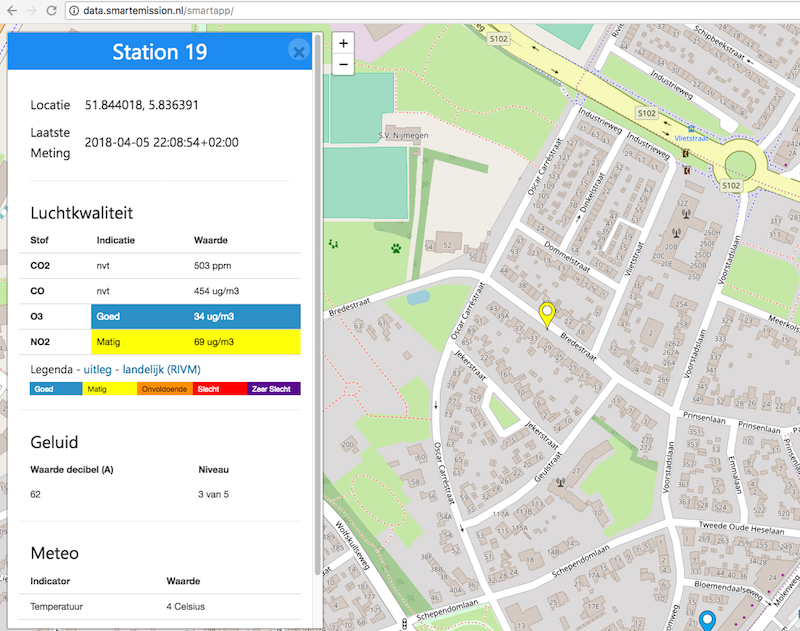
Values for these about 100 indicators are sampled about every 20 seconds. Even with about one hundred Josene sensor stations currently one can imagine this will produce “a lot of data” to say the least. O yes, and we also like to keep all data, i.e. maintain history…Josene sensor-stations are connected via Wifi and will have to send their data to “somewhere”. Eventually, a user will need to view/consume sensor-data via an app, like the SmartApp (see image below), or web-services without being overwhelmed.
So how does the SE Platform deal with this potential tsunami of data? Well, the keywords are Buffering, Harvesting and Aggregation. Back to following the data. Each Josense sensor station will constantly push its data to what is called a Data Collector within the SE architecture. A Data Collector is basically a buffer (server) that will store bulk “timeseries” data for each station. Data is stored in bulk, i.e. not every sample is stored in an individual record but as blobs. The granularity is one blob per station/per day/per hour. This already reduces data records to 24 blobs per day per station. A lot of storage but a reasonable number of records. Also remind: this is raw, unvalidated, unaggregated data. Best is to first show a picture from the global architecture as below.
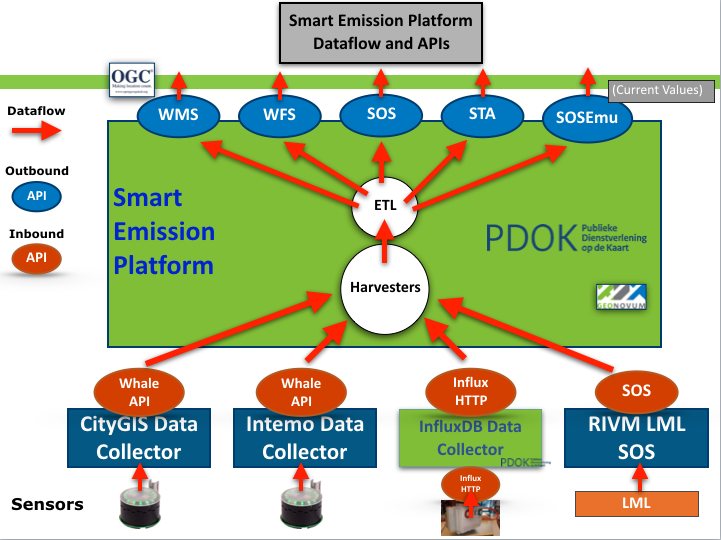
Starting at the bottom of the picture above: Sensors send (push) their raw data to their attached Data Collector. Currently this even happens outside the SE Platform: the two Data Collectors from the left are maintained by our partners Intemo (Intemo Data Collector) and CityGIS (CityGIS Data Collector) within their own premises. In the course of the project we have been adding another Data Collector based on InfluxDB for the AirSensEUR. Also the RIVM SOS is viewed as a Data Collector for purposes of Calibration (for another Emit).
The important notice is that the SE Platform deploys Harvesters that constantly Pull the raw data from a series of Data Collectors. So this is where the Push/Pull decoupling is realized. For this (Pull) we have developed a simple Raw Sensor REST API nicknamed the Whale API. Each Data Collector exposes its buffered bulk data (history) as JSON Blobs via this very simple API, independent from its internal storage technology. One may ask: why all this unnecessary indirection? Basically, here we have the Push/Pull decoupling realized. This gave us many advantages:
- Sensors only need “one IP-address to send to”
- Data Collectors can be optimized for their purpose
- The Whale API provides a thin interface while still allowing transfer of bulk data
- The Whale API also provides “last/current” values, so a quick pass-through for near-realtime data
- Harvesters can run at their own pace/schedule
- The SE Platform can be deployed anywhere, in Test, Production phases and build-up its data
- Development and testing can be done locally, on a development laptop even
- Data Collectors provide bulk-data from “time zero” so when moving/migrating SE servers or re-architecting ETL or Calibration algorithms we can re-bootstrap from “time-zero”
More details can be found within the ever-evolving Smart Platform Technical documentation . As said, we are in the process of migration. Basically moving all software from a single SE GitHub repo at Geonovum to our new GitHub organization and SE DockerHub , so look into the latter for the current/upcoming status.
So within this Emit I tried to depict how sensor-data “gets into the platform without overwhelming it”. So the Harvesters keep on Harvesting, but what next? Like Neil Young sings in Harvest: “Dream up, dream up, let me fill your cup. With the promise of a man.” That is, I promise a next Emit #5 on After The Goldrush, sorry After The Harvest.