Emit #1 – Into Spatiotemporal
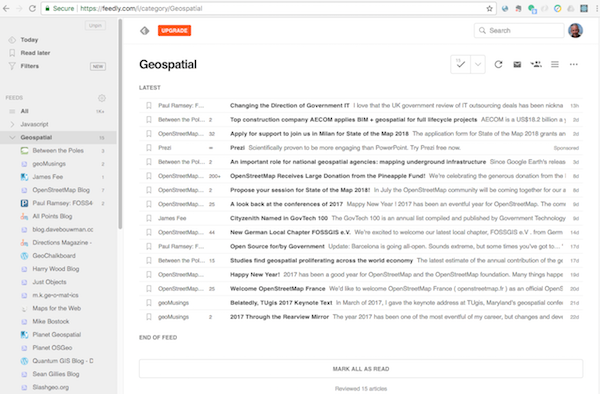
One of my new year’s resolutions for 2018 was to “blog more”. Not being very active on the well-known social media: a bit tired of Twitter, never really into Facebook, bit of LinkedIn. OSGeo mailing lists , GitHub and Gitter is where you can find me most (thanks Jody, for reminding!). And I read many blogs, especially on my Nexus 10 tablet and Fairphone 2 via the awesome Feedly App. If you have not heard of Feedly (or any other blog-feed collectors), stop here and check out Feedly ! Most blogs (like this one) provide an RSS/Atom-feed . Via Feedly you can search/add RSS-feeds and thus create your own “reading table”. My favorite feeds are related to Open Source Geospatial, Python and IoT, like:
- planet.osgeo.org – the OSGeo blog aggregator, must-read if you’re in Open Geospatial
- Sean Gillies blog – developer at MapBox a.o. of Fiona , GeoPython, geospatial and personal stuff
- Planet Python – all Python
Enough sidestepping, my goal is to share tech around the Open Source Smart Emission Platform (SE Platform) in a series of posts, dubbed ‘Emits’. This is Emit #1. Since 2014 I have been working on several projects, often through Geonovum , and recently via the European Union Joint Research Centre (JRC), that deal with the acquisition, management, web-api-unlocking and visualization of environmental sensor-data, mainly for Air Quality (AQ).
What made these projects exciting for me is that they brought together many aspects and technologies (read: Open Source projects and OSGeo software ) I had been working on through the years. Also, it was the first time I got back into Environmental Chemistry, for which I hold a master’s degree from the University of Amsterdam, co-authoring some publications , yes, many many years ago.
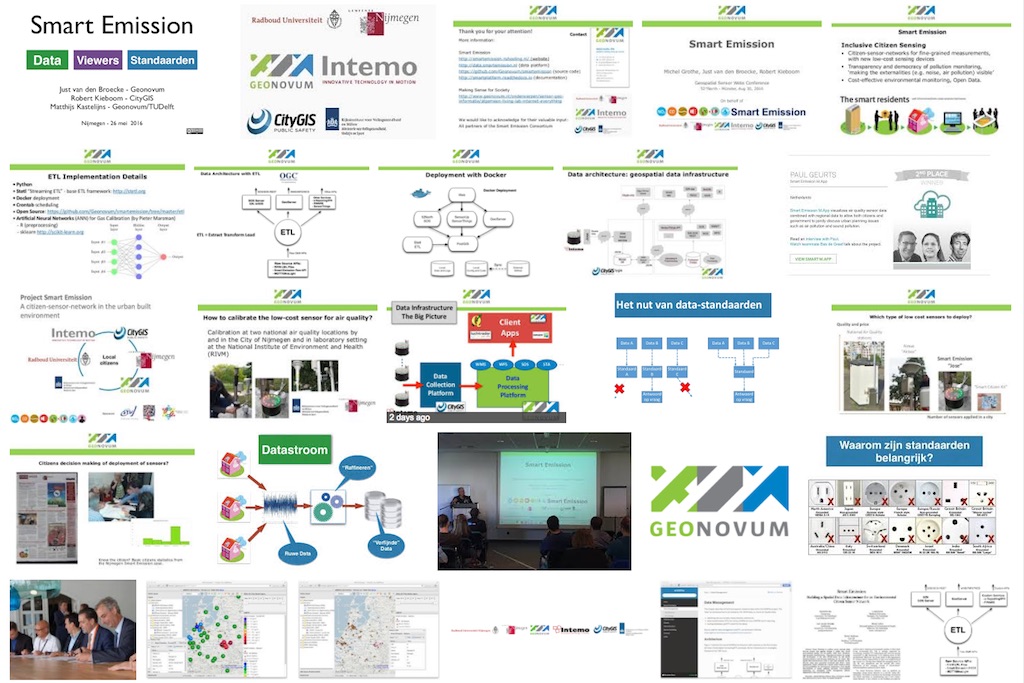
So what is the Smart Emission Platform and what makes it exciting and relevant? In a nutshell (read the tech doc here ): The goal of the SE Platform is to facilitate the acquisition (harvesting) of sensor-data from a multitude of sensor devices and make this data available via standardized formats and web-APIs (mainly: OGC Standards ) and Viewers. The SE Platform originates, what is now called the award-winning , Smart Emission Nijmegen project in 2015-2017. Quoting from the paper “Filling the feedback gap of place-related externalities in smart cities” {.reference.external} :
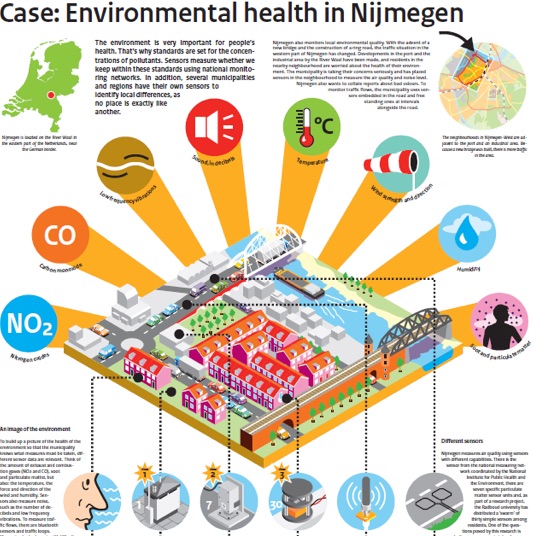
“…we present the set-up of the pilot experiment in project “Smart Emission”, constructing an experimental citizen-sensor-network in the city of Nijmegen. This project, as part of research program ‘Maps 4 Society,’ is one of the currently running Smart City projects in the Netherlands. A number of social, technical and governmental innovations are put together in this project: (1) innovative sensing method: new, low-cost sensors are being designed and built in the project and tested in practice, using small sensing-modules that measure air quality indicators, amongst others NO2, CO2, ozone, temperature and noise load. (2) big data: the measured data forms a refined data-flow from sensing points at places where people live and work: thus forming a ‘big _picture’ to build a real-time, in-depth understanding of the local distribution of urban air quality (3)_empowering citizens by making visible the ‘externality’ of urban air quality and feeding this into a bottom-up planning process: the community in the target area get the co-decision-making control over where the sensors are placed, co-interpret the mapped feedback data, discuss and collectively explore possible options for improvement (supported by a Maptable instrument) to get a fair and ‘better’ distribution of air pollution in the city, balanced against other spatial qualities. ….”
So from the outset the SE Platform is geared towards connecting citizen-owned sensor devices. Many similar programs and initiatives are currently evolving, often under the flag of Citizen Science and Smart Cities. Within the Netherlands, where the SE Nijmegen project originated, the Dutch National Institute for Public Health and the Environment (RIVM) was an active project partner, and still stimulates citizens measuring Air Quality via a project and portal: “Together Measuring Air Quality” . In the context of discussions on Air Quality, climate change and lowering budgets for governmental environmental institutions, citizen-participation becomes more and more relevant. A whole series of blogs could be devoted to social and political aspects of Citizen Science, but I will stick to tech-stuff here.
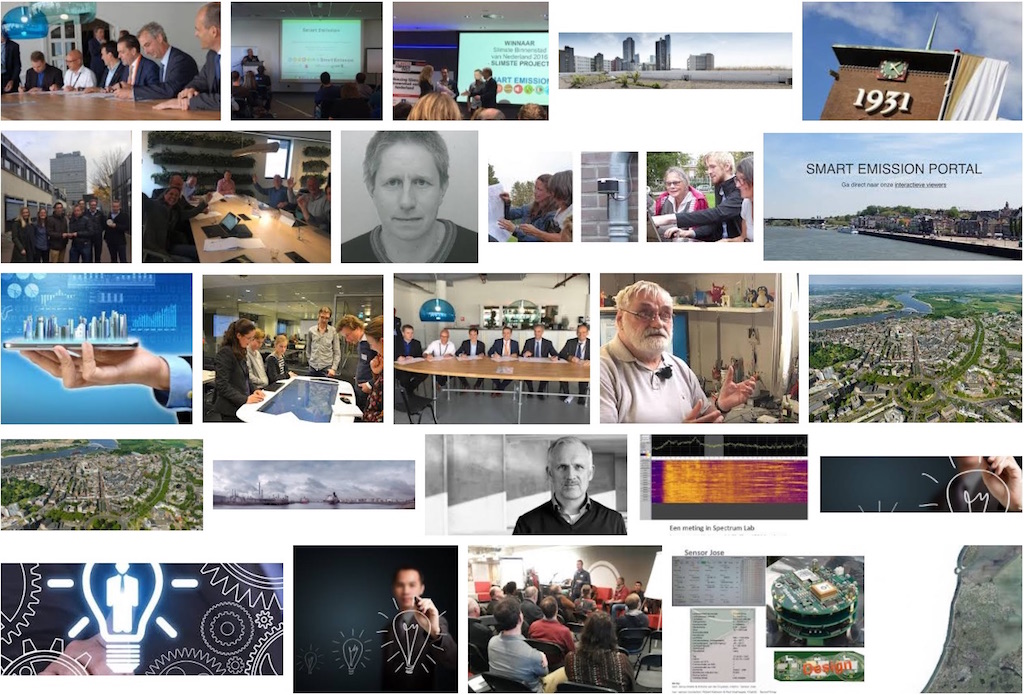
What made working on the SE Nijmegen project exciting and challenging, is that I was given time and opportunity by the project partners (see pic) to not just build a one-time project-specific piece of software, but a reusable set of Open Source components: the Smart Emission Platform ([sources on GitHub][42]).
Having had some earlier experience within the Geonovum SOSPilot project (2014-2015), investigating among others the OGC Sensor Observation Service to unlock RIVM AQ data (LML) , I was aware of the challenges dealing with what can be called Spatiotemporal (Big) Data.
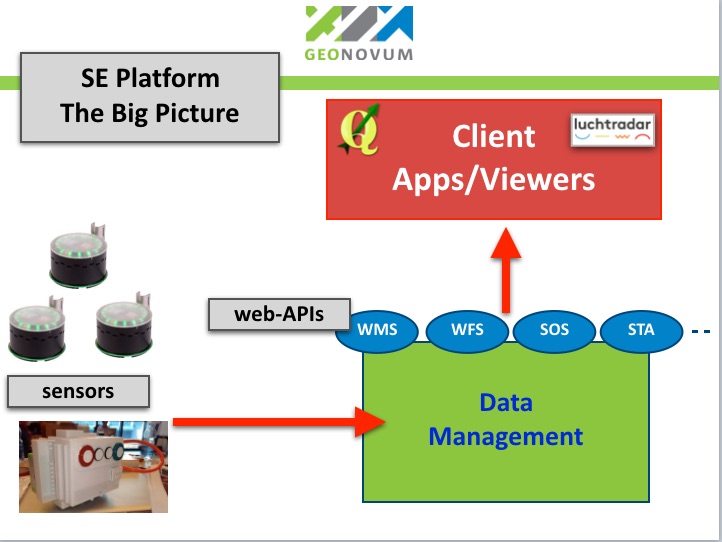
The figure below shows The Big Picture of the SE Platform. Red arrows denote the flow of data: originating from sensor devices, going through Data Management (ETL), unlocked via various web-APIs, and finally “consumed” in client-apps and viewers.
There are many aspects of the SE Platform that can be expanded. These are for upcoming Emits. For now a summary of some of the challenges and applied technologies, to be detailed later:
- raw data from sensors: requires refinement: validation/calibration/aggregation
- dealing with Big Data that is both spatial (location-based) and temporal (time-based)
- applying an Artificial Neural Network (ANN) for sensor-data calibration
- databases for Spatiotemporal data: PostGIS and InfluxDB and TICK Stack
- applying the Stetl framework for all data management (ETL)
- metadata for sensors and sensor networks, always a tough and often avoided subject
- connecting the Open Hardware EU JRC AirSensEUR AQ sensor-box to the SE Platform
- using OGC WMS (with Dimensions for Time) and WFS for viewing and downloading sensor data
- is OGC Sensor Observation Service (SOS) and SWE still viable?
- how powerful is the OGC SensorThings API (STA) standard?
- deployment with Docker and Docker Compose
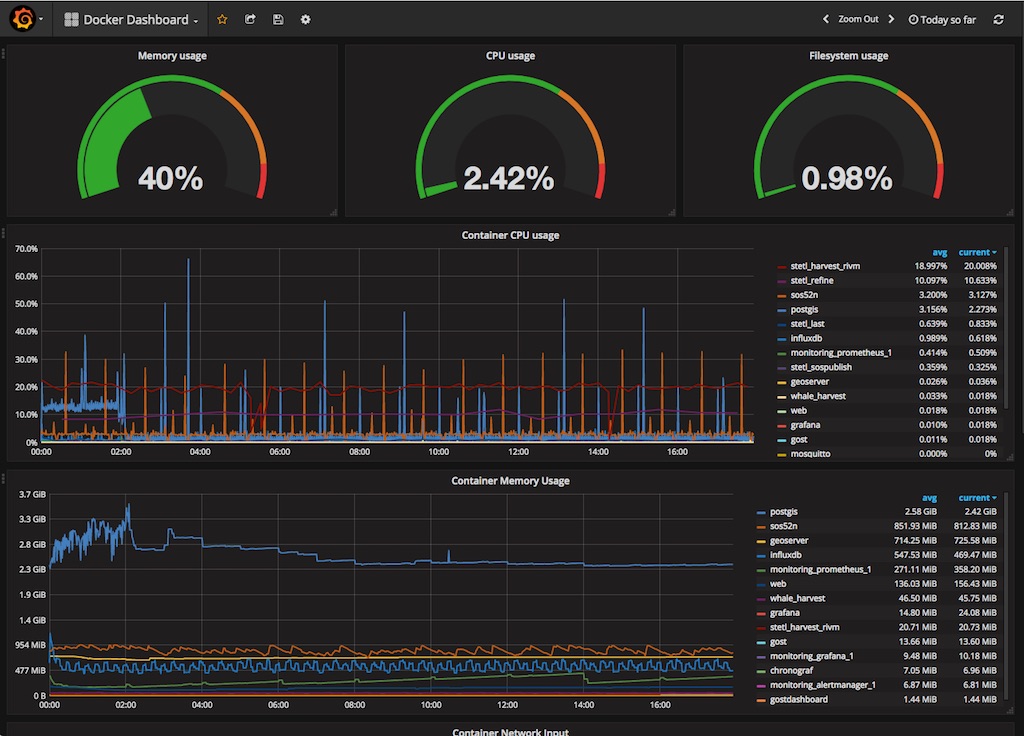
- Docker and host systems monitoring: Prometheus + Grafana
- OGC Services Monitoring with GeoHealthCheck
- Visualizations: custom viewers with Heron /Leaflet/OpenLayers, Grafana dashboards
- from development to test and production: Vagrant+VirtualBox , Ubuntu, Docker
- using component-subsets of the platform for small deployments
A lot of stuff to uncover, hopefully got your interest if you have read all the way to here. Will try to treat one aspect/technology in each subsequent Emit-blog post. And off course the entire SE platform is Open Source (GNU GPL), so you are free to download and experiment, and maybe even would like to contribute.