Cheers to 2018
Never too late to look back. Inspired by the concise bullet-point-style of Tom Kralidis’ Cheers to 2018 , my personal highlights of living and working in the Open Source Geospatial and OSGeo(.nl|org)-world in 2018. I’ll post 2019 reso’s later. Not just personal projects, but also events from the OSGeo.nl Local Chapter in which I am involved since its beginnings.
January
- One of my 2018-resolutions was to focus more on SensorWeb/Spatiotemporal inspired by working since 2015 on the Smart Emission project . Started a blog-post-series “Emits” .
- With OSGeo.nl we always start the year (since 2011) with a joint OSGeo.nl and OpenStreetMap NL new-years party at Cafe Dudok in Hilversum. Many of the 2018-plans discussed there became reality. Not at least the two QGIS-Days and FOSS4G-NL 2018 conference (see below).
- The first Dutch QGIS Day hosted by the IHE Delft Institute for Water Education . Very well attended (160?) by both regular QGIS-users and IHE-students. Big thanks to Erik Meerburg (what would OSGeo.nl be without Erik?) and Hans van der Kwast (IHE).
- Started working on a contract for the European Commission Joint Research Center (Ispra, Italy) to deploy five AirSensEUR air-quality stations within the Netherlands, connecting these to the Smart Emission Platform . More in this blog-post .
February
- As first-timer went to TheThingsNetwork Conference . What an amazing event! For some years already into Lora(WAN) and maintaining a TTN Gateway, I learned so much, also from the workshops there, that I wrote a separate blog-post about this event .
- Started contracting (eventually until sept 30, 2018) at Dutch Kadaster to migrate the entire Smart Emission (SE) Platform to Kadaster infrastructure. Initially just migrating the SE Docker Images , normally two-weeks (to be honest, a day’s) work, BUT, as a (nice) surprise learned we had to move SE “To The Cloud”, that is to Azure Kubernetes (AKS) , well that kept me and one Kadaster-colleague (learned a lot from you Gerwin!) busy till end of september at least 2-3 days a week!
March
- As first-timer went to the OSGeo 2018 Code Sprint in Bonn . Mainly to work on GeoHealthCheck . (GHC). Another highlight! Not the least since I finally met the great Tom Kralidis ! I had been working on GHC with Tom a couple of years but we somehow never met IRL. Spent most of week on a single PR (per-Resource scheduling ) which required a re-architecture of GHC. But more importantly socializing with Tom and other folks there, well, Bonn, need I say more…Thanks organizers: Astrid Emde et al. for this great week!
- In that same codesprint week I also attended several talks at the yearly FOSSGIS Conference there. The FOSSGIS Conference is a major event in Europe as it involves all German-speaking (DACH) countries, plus their OpenStreetMap communities. Even with my high-school German language knowledge very well to follow. As an exception to the rule I was grateful to be allowed to give a GeoHealthCheck presentation in English. Thanks to CCC , FOSSGIS always videotapes all talks, so you can watch some of my stuttering here .
April
- With OSGeo.nl we and our community-members more and more try to organize small, hands-on events that are lightweight to organize. The NLExtract Hacking Day was a success! Thanks to organizer Frank Steggink (who also wrote the report), and a great space offered by WebMapper (Edward MacGillavry) in the Social Impact Factory Utrecht.
May
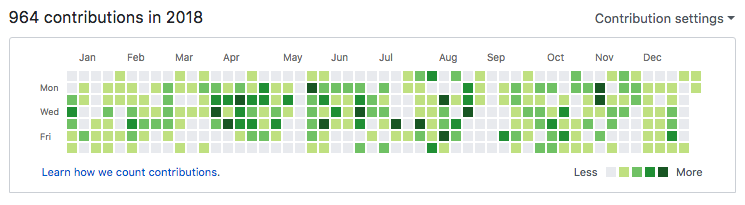
- What happened in this month? Luckily GitHub tracks my activity. Many commits for the Smart Emission Kubernetes challenge. I see a week without commits in May: made a great hiking trip with friends in Ireland: the Kerry Way . Rain? Only one evening when walking to the pub (always live music there)!
June
- More work on map5.nl , a subscription service for Dutch topographic, historical- and embellished hillshade and arial maps I started to host in 2015. Plus ongoing Smart Emission stuff.
- Gradually, a heat-wave was overtaking The Netherlands. Climate change?
July
- Heat-wave more and more building up.. But that did not stop the great OSGeo.nl organizing team to host the second FOSS4G-NL in Almere . July 10-11. Kudos to Erik Meerburg and team for two great days of workshops and conf!
- At the FOSS4G-NL I had the honor to open the conference and present the national Dutch GeoForum: geoforum.nl. We jointly (Kadaster, WebMapper, OSGeo.nl) extended the existing Dutch Kadaster PDOK Forum. As OSGeo.nl we did not want to launch yet another forum but to bundle forces. Since that launch hundreds of folks registered.
- Week after: off to FOSS4G-EU in Guimarães ,Portugal. FOSS4G-EU is always something special. Folks gather from literally every country in Europe. From the Baltic States to Croatia. In a cosy atmosphere Jorge Gustavo Rocha and the LOC made this into a great event. Great talks during the day and every evening (and sometimes nights) in this small-town university city it was easy to find and gather with the OSGeo-folks on the main square Largo da Oliveira .
August
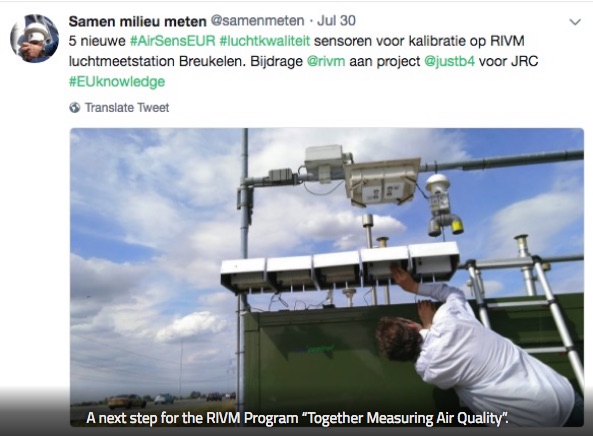
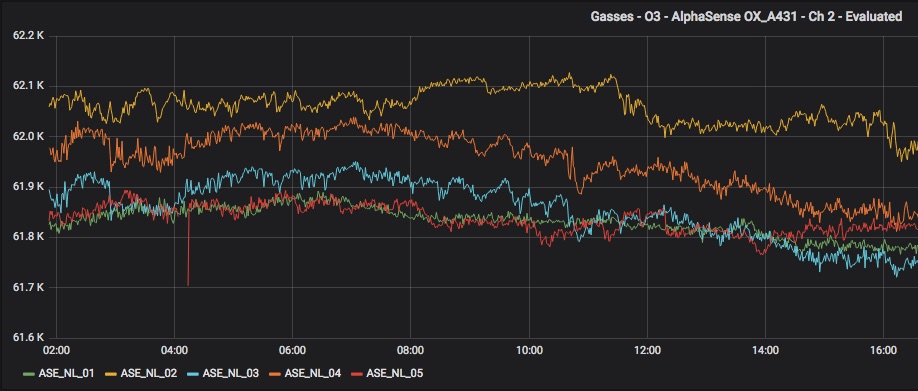
- Started to seriously deploy the five AirSensEUR (ASE) stations. First at an RIVM air quality station in Breukelen next to the main A2 highway. With the great help of Jan Vonk of RIVM we managed to attach and digitally connect these stations at their premises. To have an idea, read my blog post on this effort . The ASE stations will gather raw, uncalibrated, Air Quality data there for two months and use the onsite RIVM measurements as reference for later calibration.
September
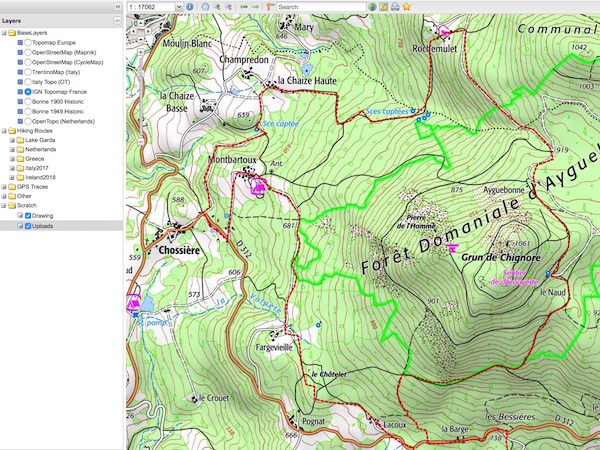
- Again a small gap in my GitHub commit history: two weeks with my family (and our great Labrador Jamie) in rural France: Auvergne and Ardeche. I always love to set out GPS-hikes at home, hacking some of the French IGN topo-maps for personal use, and see how these turn out on the spot.
Oktober
-
Contract with Dutch Kadaster ended on sept 30. Just in time we migrated the entire Smart Emission stack to Azure Kubernetes (AKS). Well, IMHO Kubernetes is just awesome, especially after a few years of ad-hoc Docker deployment. Yes, a learning curve and devops-paradigm shift. Though for smaller projects in 2019 I am now combining Ansible with Docker (Compose).
-
After two months of gathering data for calibration, deployed the five AirSensEUR (ASE) stations at their target locations within The Netherlands. At each location challenges: an ASE needs 3 things: 1) to be firmly/rain-protected mounted physically, 2) 220V current and 3) WIFI. That combination turned out to be a challenge at each spot. But finally all five ASEs are now humming at their spots.
-
And with OSGeo.nl we had the second 2018 QGIS-Day at Ordina Utrecht . Thanks to the LOC: Jonas, Coen et al. Observation: all hands-on workshops were overcrowded!
November
-
More work on map5.nl and working on a next SAAS: GeoHealthCheck in the Cloud, as a subscription service, under the name geoqos (“Geo-Cause”) on geoqos.com . Hopefully that makes the GeoHealthCheck project sustainable.
-
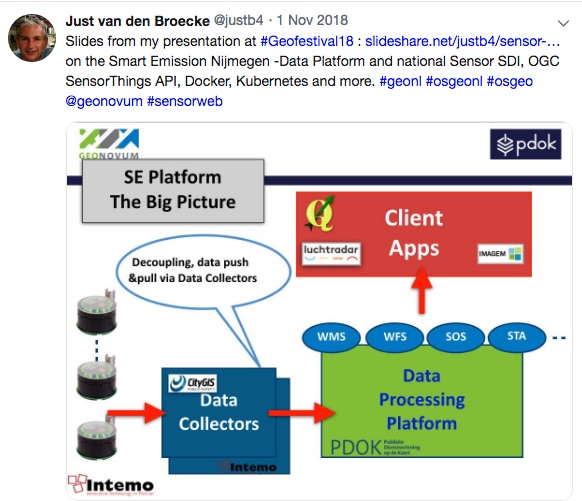
Presented Smart Emission at the Geo Users Festival by Geonovum . Bit of beamer issues, my slides on Slideshare .
-
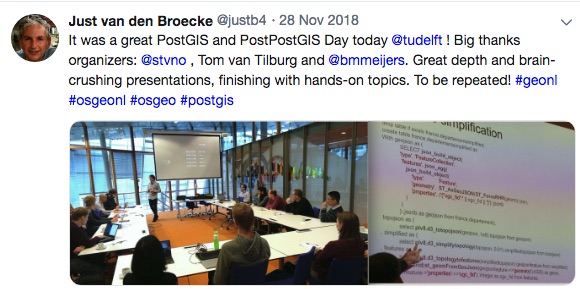
What’s that day after the GIS Day ? Yes, the PostGIS Day ! That’s exactly what the LOC team (Steven M. Ottens and Tom van Tilburg) organized. Deliberately keeping it low-profile to attract high-profile PostGIS hackers. And how they did! The format was an unconference . Even as a considered PostGIS veteran (starting with a PostGIS workshop from Paul Ramsey in Lausanne 2006 ) my brain was crushing hearing stuff like from Martijn Meijers - Indexing AIS data / point clouds with a Space Filling Curve .
December
-
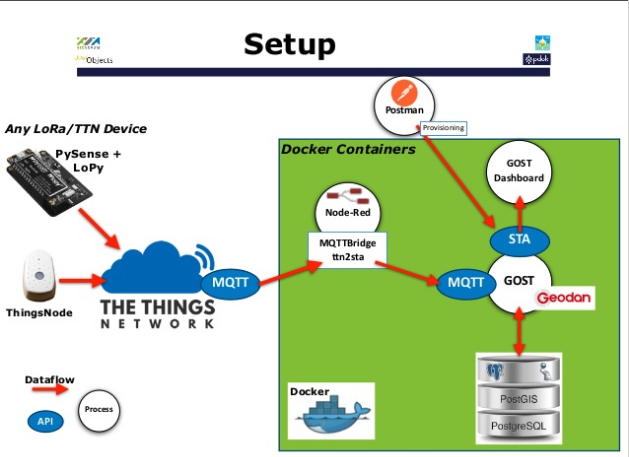
Through my various projects thinking: All GeoData is Spatio-Temporal. Presented in Eindhoven at a Ruimteschepper event: LoRaWAN TheThingsNetwork makers event. Slides are here . For one thing attempted to bridge the world of IoT with OGC SensorWeb via the SensorThings API in a PoC.
-
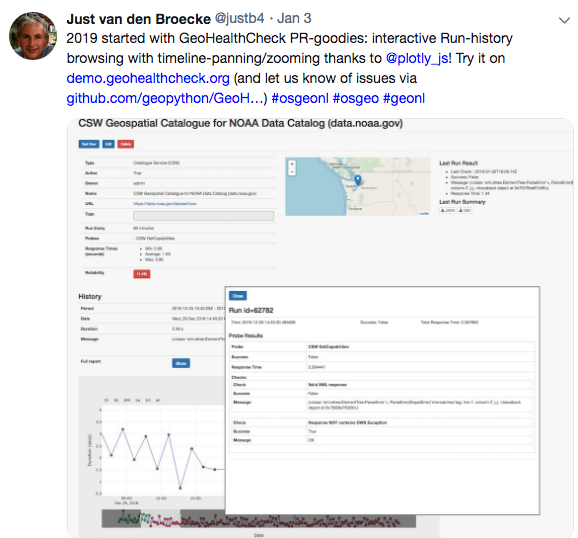
That’s almost it of 2018. A last brainwave on GeoHealthCheck usability made me to introduce interactive Plotly.js based interactive history Run-graphs. Together with and thanks to Tom Kralidis reviewing that was my final GitHub commit in 2018. Ok finalized on jan 3, 2019 but what a year!